When we were starting our review of the latest batch of market stats from the good folks at the Toronto Regional Real Estate Board (TRREB), something immediately stood out, namely the level of active listings in Toronto and the closest regions to Toronto.
In Toronto, Halton, Peel and York, we started May with the highest ever level of active listings (properties for sale) on the market. Durham was just 30 listings shy of their all time record high, so we’ll include the Durham region as well.
With more properties for sale than ever before, it’s worth doing a dive into how this happened and specifically what types of properties are for sale now, and at what price points?
Let’s get into it.
How’d this happen?
We’re going to answer the question of how did this happen from a technical standpoint, rather than a philosophical one! There are many factors influencing why the year so far has played out this way, but the below chart is a very clear explanation as to how we ended up with this record level of active listings in the city.
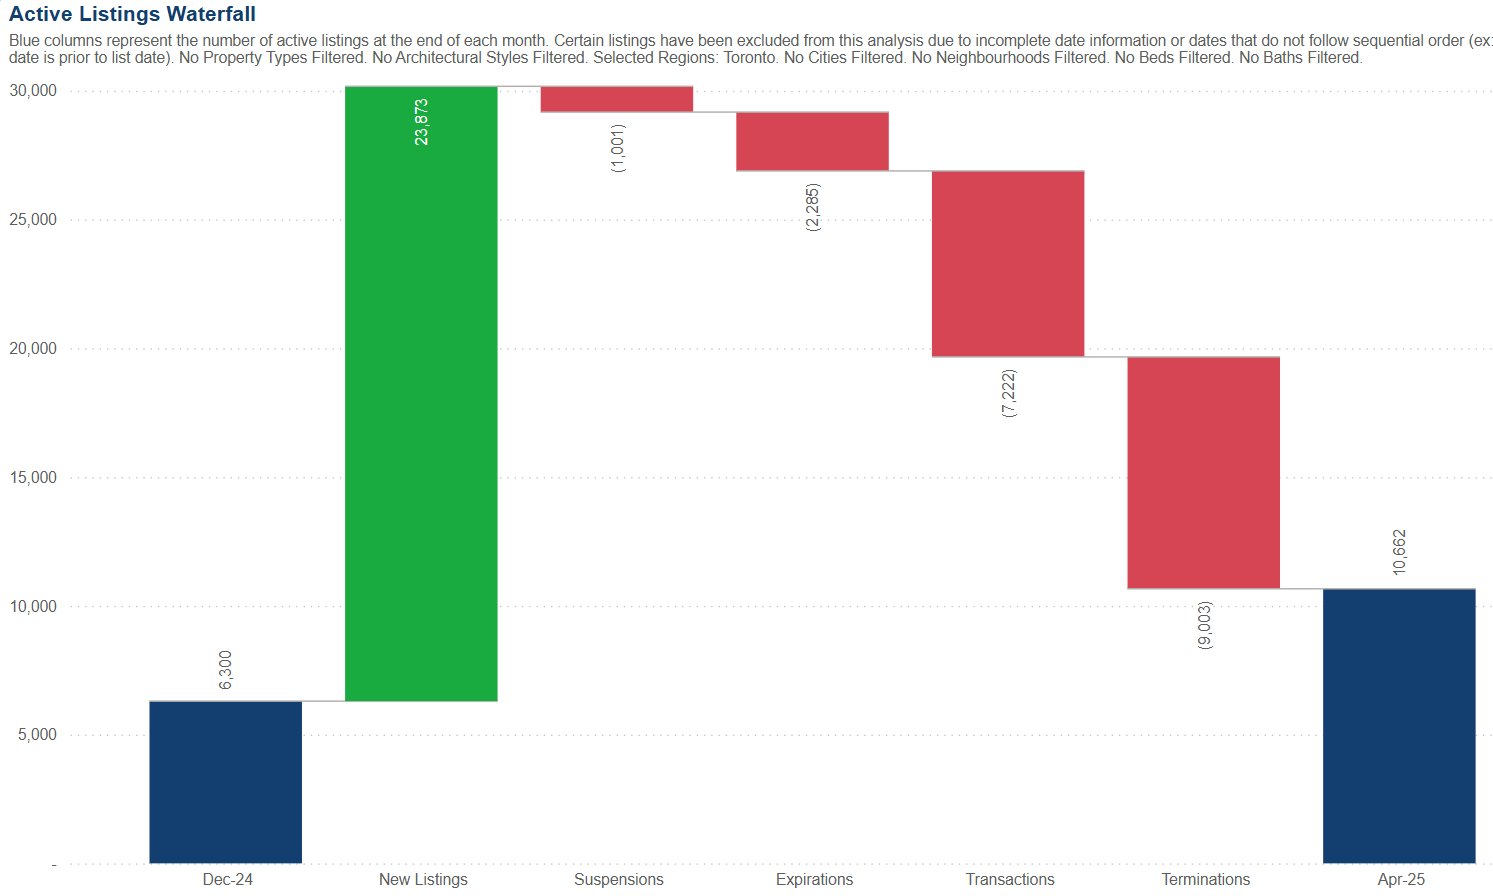
Let’s work our way across.
The first blue column is the number of active listings as of the end of December, 2024. We had 6,300 active listings in Toronto as of the start of 2025.
Over the next four months, we had 23,873 new listings come on the market. That’s the green column.
During the same time period we had 1,001 suspensions (the first red bar), which is when a listing is put on hold by the seller. Now, this is supposed to be a temporary measure, for example if a seller is ill and can’t allow showings for a week. Some suspensions are genuine, but in our experience, the majority of them are actually no longer for sale. The listing agent suspended the listing and never bothered to do the paperwork to get it properly terminated.
From January to end of April, we also had 2,285 expirations (the 2nd red bar), which are listings that reached the end of the agreed upon listing period and automatically expired.
Our third red bar is transactions, which means sales. We had 7,222 sales in Toronto in the first four months of the year. That’s a bit low, but not shockingly low compared to historical data. In 2024 and 2023 we had about 8,700 sales in the first four months, so we’re down about 1,500 sales, or about 18% lower.
Our fourth and final red bar is terminations, and we had 9,003 in the first four months of 2025. We know for certain that some of those terminations (and indeed some of the expirations and even suspensions) would have come back onto the market and shown up as a “new” listing during the year so far.
As a result of where we started (with 6,300 active listings), what came on the market (about 24,000 new listings), what came off the market (about 19,500 through suspensions, expirations, sales and terminations), we started May, 2025 with 10,662 active listings.
So, there’s the “most ever” of every type of property for sale?
When we get into the specifics of what is on the market, we see nuances to the current market composition.
Every geographic area has a different composition and we’ll review Toronto to give an example of how it looks when we dig deeper.
The below chart shows the active listings in Toronto by property type.
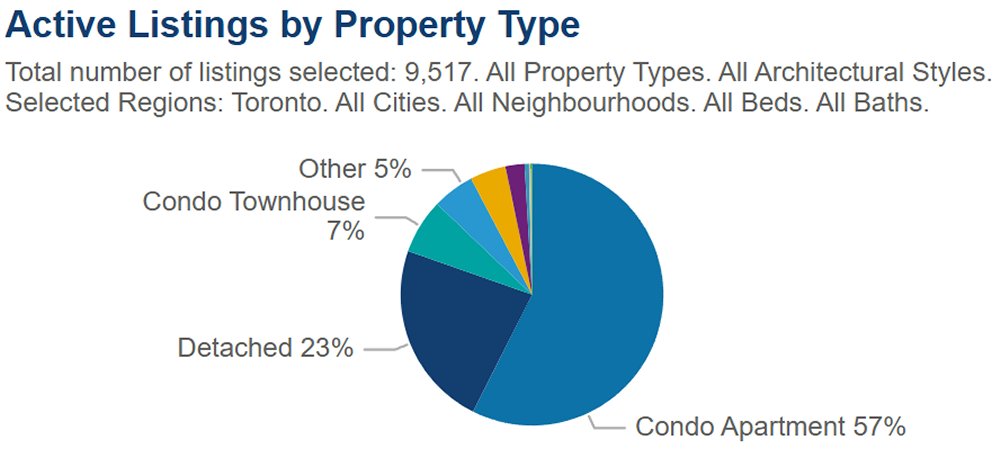
Three types of housing make up 87% of the homes for sale right now. Condo apartment units are the biggest piece of the pie, with 57% of the record level of active listings being condo units. Detached houses make up the next biggest slice and are 23% of the active listings in Toronto. The third largest type of property in the pie is condo townhouses, which represents 7% of the active inventory right now.
The remaining 13% is spread across a few different types of property. First off is Other at 5%, which is comprised of a broad mix of properties including parking spots, vacant land and other specific subsets of residential real estate. Then we have semi-detached houses, which only make up about 4.5% of the active inventory. Freehold townhouses are next and represent about 2.3% of the market. Coop housing and linked freehold homes represent the other tiny slices in the pie chart.
When we look into the historical levels of active listings for the three biggest slices of the pie right now, there are some surprising results.
- For condo apartment units, we have about 6,050 condo units for sale, which is not quite the highest ever. June 2024 and July 2024 both had slightly higher levels, but we’re within 100 of the June 2024 record high of 6,147 condo units for sale.
- Turning to detached houses, we have 2,534 of them for sale in Toronto. That is the highest ever, beating the previous record holder, September 2024, when we had 2,389 detached houses on the market.
- Condo townhouses are also currently at a record high, with 708 condo townhouse properties on the market in Toronto. The previous record holder was October 2024 when there were 680 condo townhouses for sale.
It is surprising that despite the number of headlines about the condo market problems in Toronto, we don’t actually have the highest level of units for sale that we’ve ever seen. At the same time, we’re not seeing many media outlets picking up on the fact that the holy grail of Toronto properties, the detached house, is seeing its highest ever level of inventory right now.
An important component to the story is which price points are seeing the highest levels of inventory, so let’s dig into that now.
What’s your budget? It definitely still matters.
When we look at how the inventory on the market is spread out across different price ranges, you see a few places where you’ve got more options.
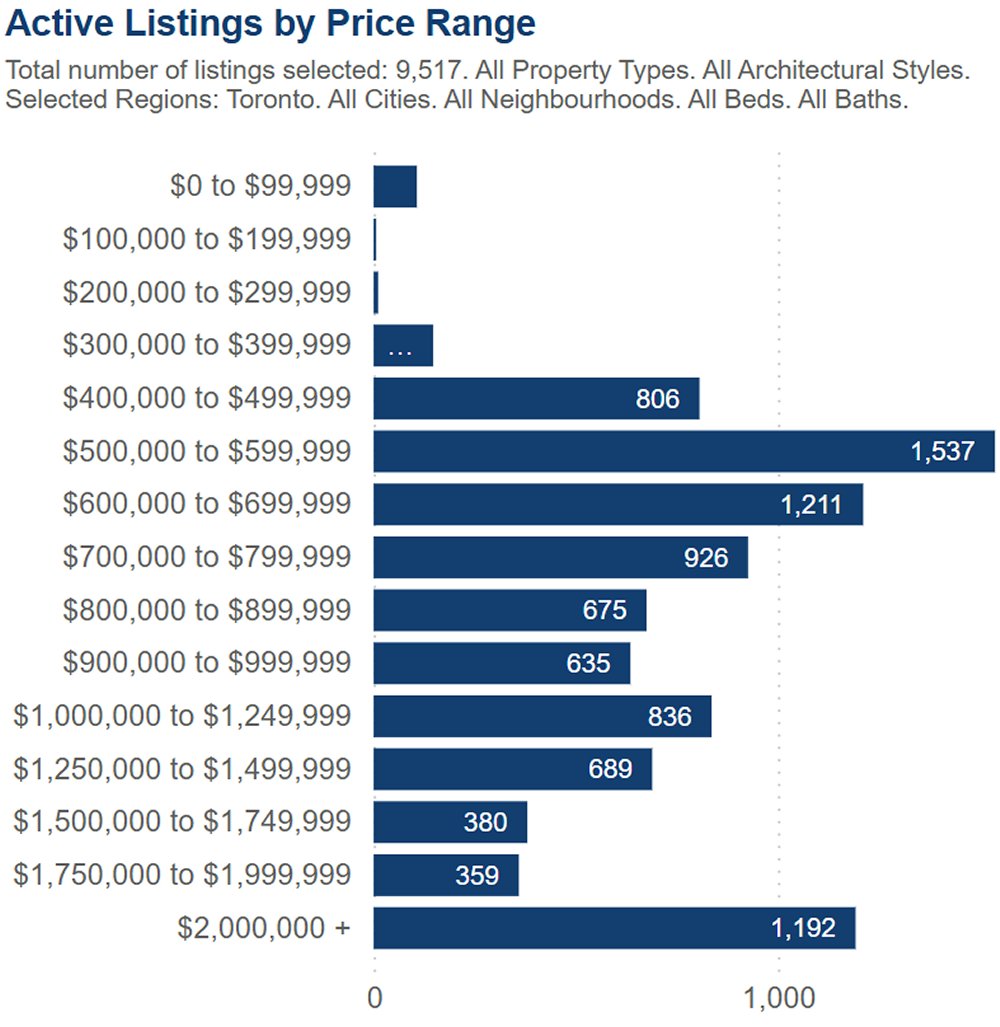
There’s a few things worth noting about the above chart.
- The biggest concentration of inventory is for sale in the $500K to $599K band, with over 1,500 options if that’s your budget.
- After that, we jump up to over $2M, with almost 1,200 options if your budget is north of two million.
- The next most sizeable grouping is in the $600K to $699K range, with over 1,200 options.
Looking at this breakdown, you’d be right if you said that a buyer with a budget in the $500K to $700K range has tons of options right now. The question, however, is what type of options? If we look at active listings by price range within our two biggest segments, the story becomes more nuanced.
For condo apartment units for sale right now, here’s the active listings by price range.
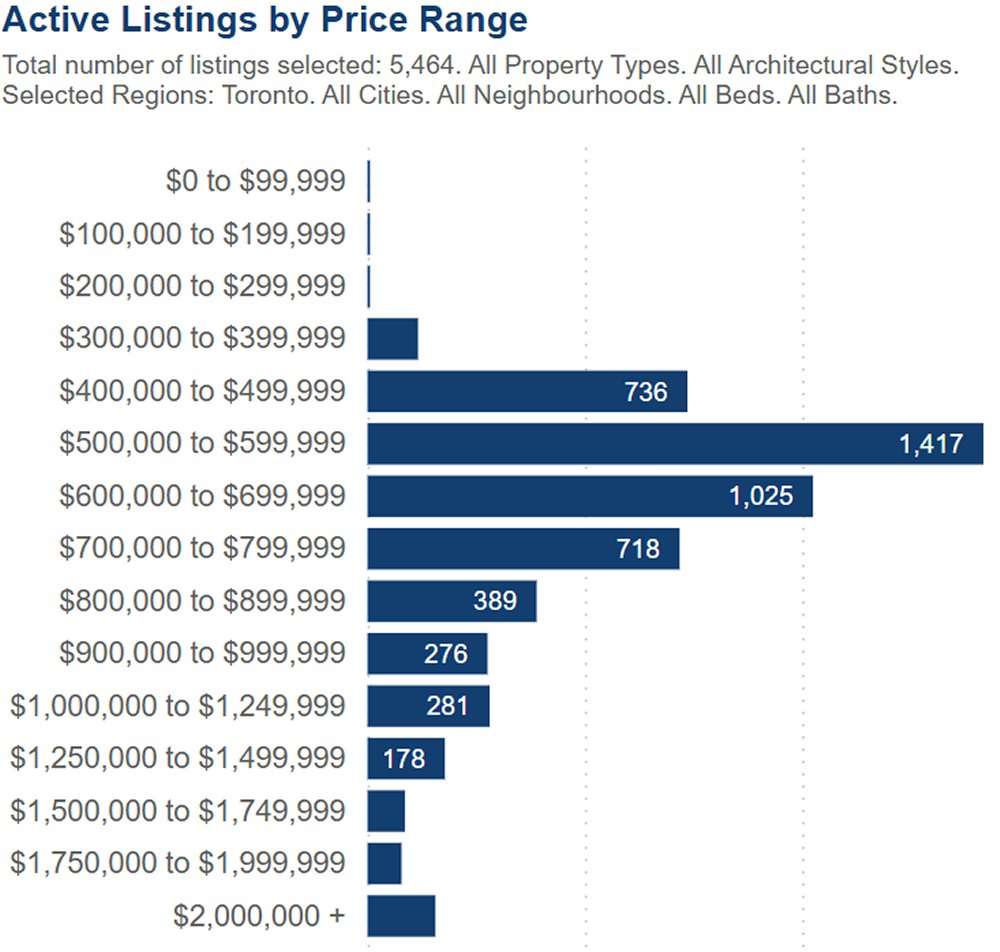
We pointed out how you’ve got a lot of options in the $500K to $599K range, with over 1,500 properties for sale in that band. Given that the condo apartment breakdown shows 1,417 options in that price band, we know that almost all of your options for that buying budget are in fact condo units.
If we switch over to the detached houses for sale by price range, here’s the chart.
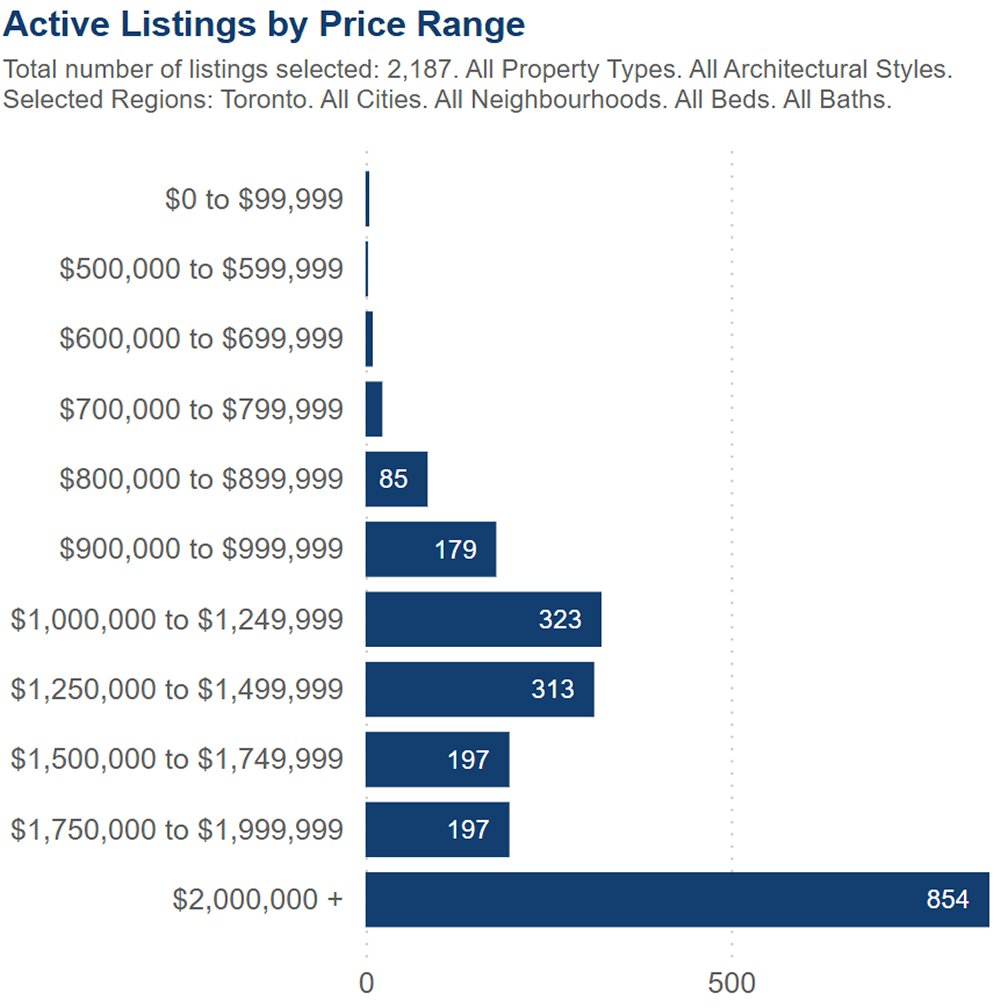
The $2M plus budget is well represented in the detached house segment of the market, with 854 of the available 2,187 detached houses costing more than $2M.
Other nuances of this segment show up in this chart, such as the fact that there more than twice as many detached houses for sale in the $900K to $999K range as there are in the $800K to $899K range. This is very useful information if you’re a buyer looking for a detached home for under $900K in the city. If you didn’t know that the concentration of detached houses increases rapidly above this price point, you’d likely be confused about the fact that there are more detached homes than ever for sale right now – but not many in your budget.
In our work with clients, we dive deep into the stats to understand what is going on in specific markets. We may start with a given geography, but we dive deep into housing types and price bands to make sure the advice we’re giving is reflective of what’s going on for the type of property you’re trying to buy or sell. If you’re ready to make a move and want us to help figure out the best strategy for your purchase or sale, get in touch!
